Topic 1
Graphing a Parabola, Part 1
Before we learn how to graph a parabola, let's review what a quadratic equation is. Remember that a quadratic equation is an equation in which the variable is raised to the second power. Quadratic equations are normally written in the form `ax^2+bx+c`. Now to graph a quadratic equation, we must make a shape called a parabola. A parabola is the graph of a quadratic equation.
Now before we learn how to graph a quadratic, we must learn some important information about parabolas. Take a look at the graph of a parabola below-
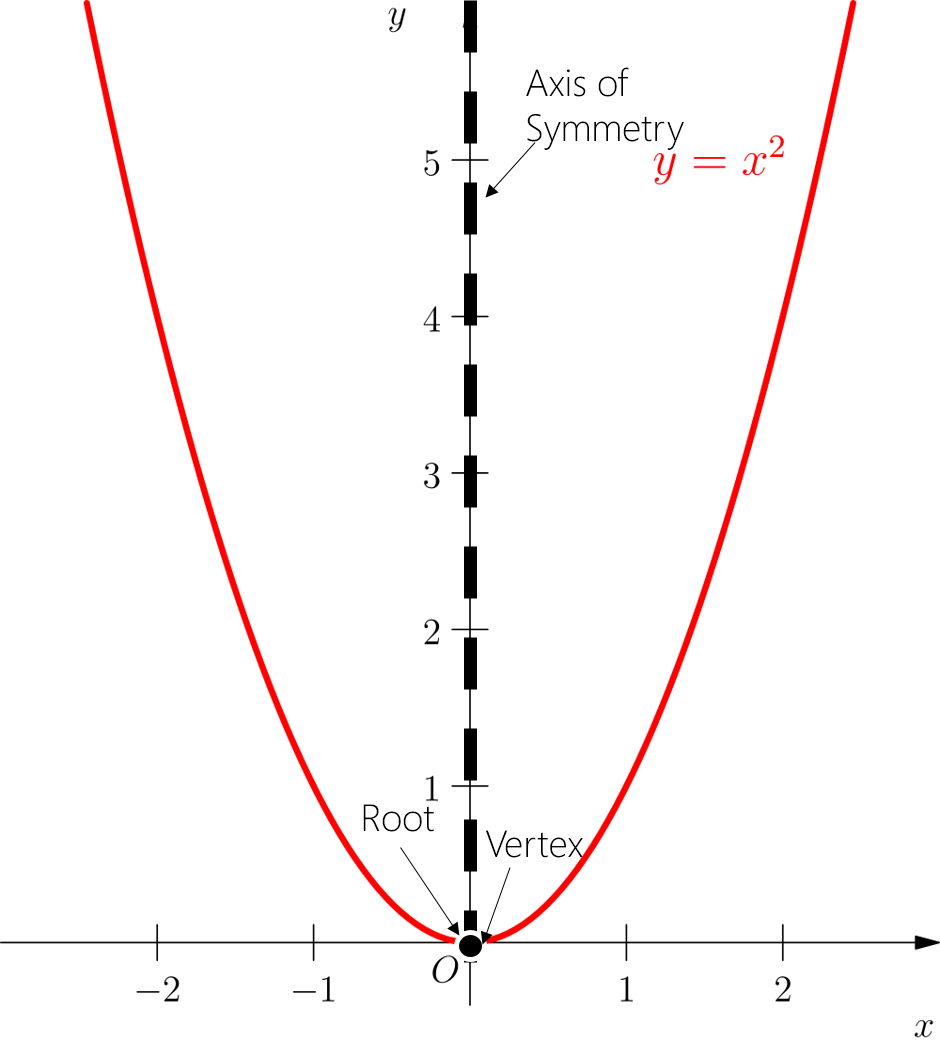
On the parabola, we can see an axis of symmetry. This is the imaginary line that passes through the vertical middle of the parabola. We can also see a vertex on the parabola. The vertex is the point where the graph of the parabola crosses through its axis of symmetry. The final label we see on there points out a root. A root is also known as an x-intercept, and it is the place where the parabola touches the x-axis. In addition to x-intercepts, or roots, we also have y-intercepts in some parabolas. You can probably guess that y-intercepts are where a parabola touches the y-axis. In this case, our parabola doesn't cross the y-axis, so we don't have a y-intercept. One more thing- the parabola in the picture is something called a concave up parabola. When we say concave up, we mean that the parabola opens upwards. If a parabola is concave down, then it opens downwards.
That's a lot to take in! Now that we know all the basics about parabolas, let's try our hand at graphing a quadratic equation. If we are given a quadratic equation in the form `ax^2+bx+c`, here are the steps to graph it-
- Find out if the parabola will be concave up or concave down. If the `a` term in the equation is positive, then it will be concave up. If the `a` term is negative, it will be concave down.
- Find the x-coordinate of the parabola's axis of symmetry. To do this, use the equation `x=(-b)/(2a)`. Just plug in the `a` and `b` terms from the equation for `a` and `b`.
- Find the vertex of the parabola. The coordinates of the vertex work like this- the x-coordinate is the answer to the equation from step 2. The y-coordinate of the vertex is obtained if you replace the x-coordinate of the vertex for `x` in the original equation and then solve. If you don't understand this step yet, don't worry. We'll go into more detail soon.
- Find the y-intercept of the parabola. The y-intercept's x-coordinate will always equal 0. The y-coordinate of the y-intercept will be equal to the digit of `c` from the original equation.
- Find the roots (x-intercepts) of the parabola. These can be obtained by replacing the `y` in the original equation with `0` and solving the equation for `x`. Remember you'll get two answers. They will both be x-intercepts.
Wow! We have a huge amount of information to process now. If you can't understand everything yet, don't worry. In the next lesson, we'll practice these concepts.